- June 28, 2023
- Industry, Marine News
- The Inland River Scene & Revisiting Tugboats 101
“Nothing frightens people more than randomness.”
-Karin Fossum, Norwegian novelist
As we have seen in worldwide marine commerce, and in commerce in general, the inland trade has been bouncing around a bit like an EKG strip. Weather patterns and international conflict have affected the grain trades, coal trade, and inverted some of the petrochemical trade. The world economy has stifled steel production and shipping and has had a knock-on effect on coal and ores.
Domestic southbound dry cargo has crashed since fall 2022. Low water conditions have not helped barge rates and usage for many barges has been below breakeven. The agricultural season in South America has been absorbing world business, as happens seasonally, depending on which one of the continents has the best weather. This has created a problem in the domestic U.S. as northbound traffic continues to thrive and pull high rates, which leaves dead-heading empty barges returning southbound.
The USDA forecast for corn calls for a 30.2% drop in crop year 2023/2024. The U.S. export commitments projection for 2023 is 6.6 MM metric tonnes. Last year, the commitments were 11.8 MM metric tonnes. The main corn producing countries show drops in exports except for Brazil which shows an increase. The original projection for Ukraine earlier this year has increased about 15% after international arrangements were made to support Ukraine crop exports.
For soybeans, the unshipped export commitments for 2023/2024 are projected to be 2.79 MM metric tonnes, down from the previous year’s projection of 9.88 MM metric tonnes. The jump in U.S. demand to produce “renewable diesel” has refineries chasing soybeans. While the refineries’ demand helps pay soybean farmers, it also prices soybeans out of the export market. This explains the south-bound deadheading of empty grain barges and very weak rates. It is anticipated that rates will go up as the harvest nears but not at goldmine levels.
The refined/biofuel southbound traffic slowed mid 2022 but increased in the first half of 2023. It may continue to grow as more refineries turn to renewable biofuels/green diesel under proposed EPA targets for 2023-2025. The demand for corn and soybeans is driven by the production of food, animal feed, and biofuel. As northern and Midwest refineries set up for bio-fuel production, their demand can siphon off these agricultural products from down river refineries.
The crude market has had its own fluctuations. It fell in 2021 with the Federal release of fuel from the Strategic Petroleum Reserve, then continued to drop with the Russian invasion of Ukraine. Southbound crude barge traffic was also hurt using new pipeline routes between the Midwest and the Gulf refineries. One major factor was the reversal of the long used Capline Pipeline. Pipeline use for northern crude has been growing for a decade but dropped due to the economic conditions of COVID-19. The volume is finally starting to grow back towards the 2019 high.
Clean oil, particularly the volume of unfinished oils (semi processed like kerosene, naphtha, and gas oils), have been the heaviest north-south traffic for several years. Since 2022, biofuels for gasoline and gasoline blending stock have dropped to 882.000 bbls from 1.43 MM bbls.
Black oil southbound has varied slightly from quarter to quarter over the past year but possibly not at a level to greatly affect the heater equipped barges. There was slightly less tonnage in the asphalt market as in black oil.
Northbound traffic of unfinished oil, like lubes and refining byproduct distillates, had a strong first quarter 2023 after a poor fourth quarter 2022.
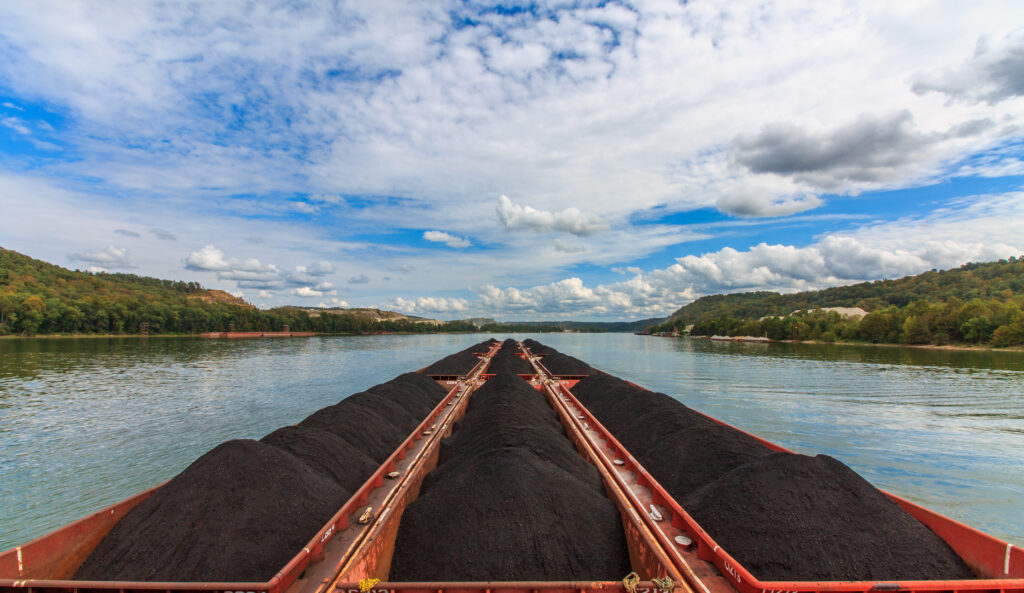
Steam coal exports YTD 2023 are above YTD 2022, but most of that is from a large increase in exports to Egypt. Metallurgical coal over the same period has greatly increased, largely due to 2022 exports to three countries (one of those an insignificant 26,000 metric tonnes) and YTD 2023 exports to six countries.
The amount of coal delivered to domestic coal fired power plants grew in the first quarter of 2023. At the same time, the coal consumption at these plants dropped due to the decrease in electrical demand. This left a 28-day coal supply on the ground. As natural gas takes over, coal fired plants will continue to shutter leaving more open hopper barges unemployed.
While the price of steel has slipped a bit, the overall cost of construction has kept the cost of new hopper barges high. As of second quarter 2023, a 200’ x 35’ x 13’ open hopper costs around $850k if built from steel coil and $950k if built from plate steel. A set of covers cost around $95k. The scrap value of one of these barges is in the range of $80k.
Tugboats 101
The first article I wrote for the ASA MTS Journal was “Tugboats 101”. Looking back at that publication, I believe it is time for a little updating. As the old marketing slogan goes, “these aren’t your father’s Buicks”.
Once upon a time, there were essentially three types of tugboats: inland/harbor, coastal, and ocean tugs. There could be overlap with some tugs that were appropriately sized, outfitted, and certified to operate in all three geographic areas. Back then, the horsepower range of a twin-screw tug was typically 1,200 to 3,500-HP. Now, harbor tugs are often 4,000 to 8,000-HP and general coastal and ocean tugs are 6,000 to 10,000-HP. This includes ATB unit tugs. The newest inland river line boat is now up to 11,000-HP. For perspective, in mid-1940’s many of the tugs that moved caissons and other war material from the U.S. East Coast to the U.K. in preparation for the D-Day invasion were single screw 300- and 600-horsepower tugs. The workhorse freighters of that time were Liberty Ships at 2,500-HP and C-2/T-2 freighters/tankers at 6,000-HP.
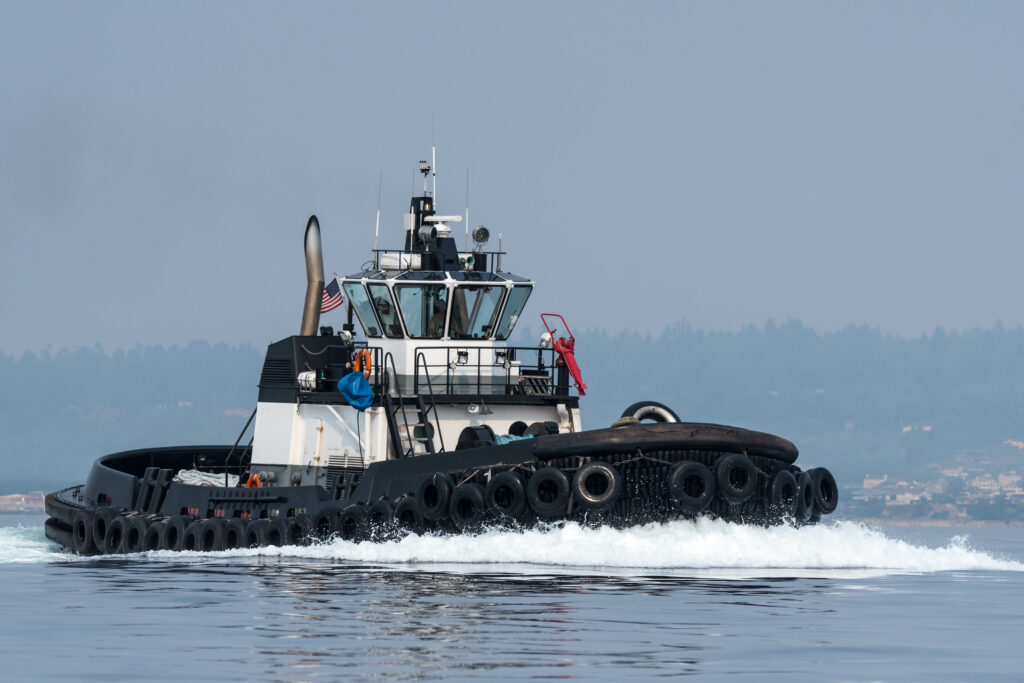
As for the length of tugs, the standard for harbor tugs worldwide is 20-30 meters (or around 95’ in the U.S.). Harbor tug length is usually restricted by the close quarters inherent in ship docking. Today, it is more of “horses for courses” with a wide selection of hull designs, propulsion engines, and drives, depending on the service needs of a harbor, sound or coastline.
Currently, harbor/escort tugs have the highest demand worldwide as container and passenger ships increase in size and capacity. The tugs used in docking and undocking now need higher horsepower and more refined winches and control systems at a higher cost. While modern ships have multiple advance thrusters, including steerable pods on passenger ships, their high profile, like that of container ships, creates sail area and can make them very difficult to control in medium to high winds.
As an aside, the soon-to-be world’s largest cruise ship, “ICON OF THE SEAS 7500” appears to have a design conceptualized by an eight-year-old with a Lego set while in a fever dream. Hopefully they have solid emergency plans in place, as this vessel will accommodate nearly 10,000 people.
Hull shapes of these escort type tugs are variations on a flat oval, or double ended design. The hull is made to be efficient whether going forward, astern, or even sideways. On most, the Bollard Pull (BP) measured strength of the efficient engine thrust, is highest when moving forward with a loss of 10% to 20% while moving astern depending on the hull shape and engine set up. They are made to move sideways in what is called an arresting mode or “indirect towing”. The drag of pulling a 94’ tug sideways acts as a brake on the ship being handled should there be an emergency. This is why harbors that accommodate larger ships (particularly tankers) must have escort tugs. You can imagine the strain on the high tech/high strength/high cost tow line and the winch pulling and brake strength when trying to slow a 1000’ vessel.
Propulsion arrangements now vary. What was once two propellors pointing aft has now advanced into two propellors or Z-drives that can swivel 360 degrees and control the direction of thrust, making these rudderless. Early Z-drive models were known as tractor tugs with steerable thrusters located forward of amidships. With the thrusters in the traditional position at the stern they became Azimuthing Stern Drive (ASD) tugs. A newer variation is the Rotor Tug with two Z-drives forward and a third drive aft.
In the mid 1990’s came Ship Docking Modules (SDM) technology via Erik Hvide of Hvide Marine. These vessels were the first to have a multidirectional hull and an engine at each end; one offset to port, the other to starboard, allowing the hull to turn in its own length. DLS was honored to be involved with Hvide fleet valuations as Mr. Hvide grew his company.
But the true beginning of rudderless propulsion began nearly 100 years ago in the 1920’s when an Austrian named Schneider paired with an engineer in his company named Voith to create the Voith-Schneider (VSP) cycloidal propellor. This is a circular plate in the bottom center of a tug’s hull that spins which creates thrust. From this plate, foil butter-knife-shaped blades point downwards and can be adjusted to direct thrust. I remember seeing these designs at work in the 1960’s when the ships I sailed on came in and out of Bremerhaven and Bremen. This design has proven its longevity but has limitations as the projecting blades restrict the water depths in which a vessel can work. Fire boats and emergency vessels require precision handling and control while holding station which makes the VSP ideal. A few years ago, I was able to take my ASA marine appraisal class on board the truly state-of-the-art fire boat, “Los Angeles Fire Boat No. 2” which was outfitted with a VSP. We saw its amazing performance firsthand as the crew carried out a test and training drill with the VSP drive balancing the strong multidirectional thrust of water cannons.
Appraisers and lenders are interested in the market value of these modern boats. As of 2022, the replacement cost new (RCN) of such tugs ranged from $2800/HP for standard ASD tugs to $3800/HP for advanced rotor tugs. These costs take into consideration the fact that harbor tugs now have three generators and battery packs with sophisticated electrical/battery monitoring and distribution computer systems. While the tugs need the high horsepower to control ships, they only need it when they are engaged in controlling the ship’s movements. For much of a workday they are idling or moving at slow speeds around the harbor and don’t need to be running 12- to 16-cylinder diesels. To save fuel, exhaust pollution, and engine wear, modern tugs are being designed as hybrids with battery powered systems and battery banks maintained with the main engines and/or the help of a secondary generator.
Domestic shipyards have moved towards government/military new construction and repair. The U.S. Navy has started producing new harbor tugs starting with the “YT-802 VALIANT” just over ten years ago to a newly launched “YT-811”. There are slight differences between the 802 and 811 but they are both from a Robert Allen Z-Tech 4500 design. Dimensions are 90’ x 38’ x 14’ and they are of 3,600-HP with a BP of around 40 tons. Propulsion is standard Z-drives with a bow winch and staple, as in modern harbor tugs. The difference in the Navy model is that the hull has forward underwater pushknees, looking somewhat like skegs, and guards aft protecting the Z‑drives. This is necessary to protect the tug and the low submerged hull of submarines. The tugs also have very extensive grey non-marking fendering and a hydraulicly operated gangway for access between the tug and a submarine. These have been built in West Coast shipyards and the newest contract for the “YT-811” and five sister vessels is reported to be $84 MM or $14 MM per vessel. That breaks down to about $3900/HP.
A Note on Retrofitting
Costs are not often available in maritime news or press releases, but a recent Splash article did provide some interesting figures on ship repowering to meet CII requirements. Some of the data comes from engine manufacturers who have a stake in ship repowering. Other data is from a paper presented to the IMO by a team from the UCL Energy Institute (University College London), a well-respected source. To meet environmental demands, it is estimated that thousands of ships will have to make changes. With the international fleet estimated at 60,000 vessels, this makes sense. Estimated cost to repower green can range from $5 MM to $15 MM depending on the size of the ship/engine(s) and the type of fuel which affects the fuel storage, delivery, and safety systems. DNV has given a rule of thumb that retrofit should not cost more than 25% of new construction cost to be economically viable. DNV also commented that they believe that currently only 10% of the world fleet are candidates for retrofitting. However, this will change over the next five to ten years as the CII compliance pressure grows. Older ships will go to scrap but those built in the last five to ten years with working life ahead of them will have to do more to comply.
-Norman Laskay
If you’d like to keep this conversation going, please email me at nlaskay@DLSmarine.com
